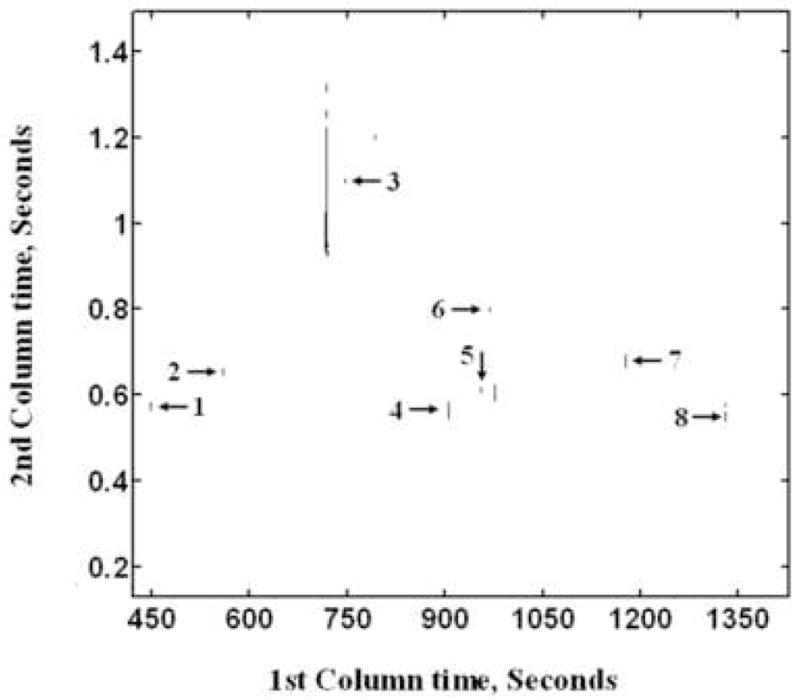
Figure 6.

The 2D sum of Fisher ratio plots for m/z 40 to 400. Compounds identified by matching to library mass spectra are labeled as (1) pyruvate, (2) 3-hydroxybutyric acid, (3) fumaric acid, (4) 3-oxoglutaric acid, (5) 2-hydroxyglutaric acid, (6) α-ketoglutaric acid, (7) citric acid, (8) palmitic acid.
