
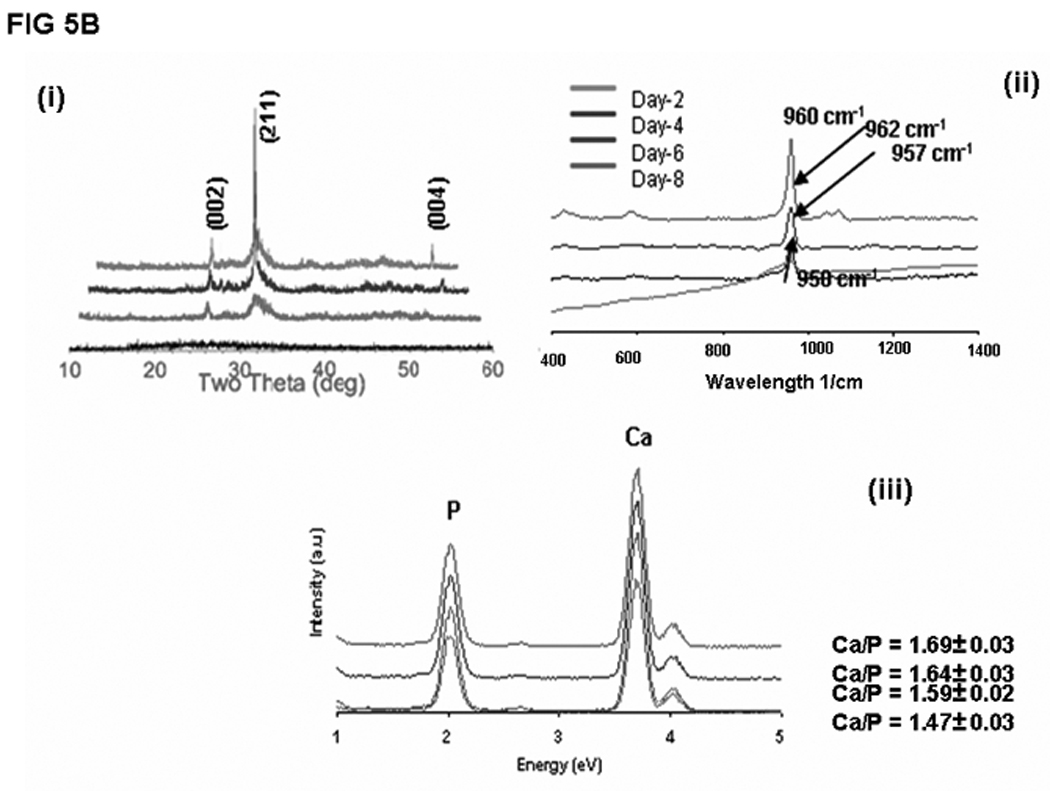
Figure 5.
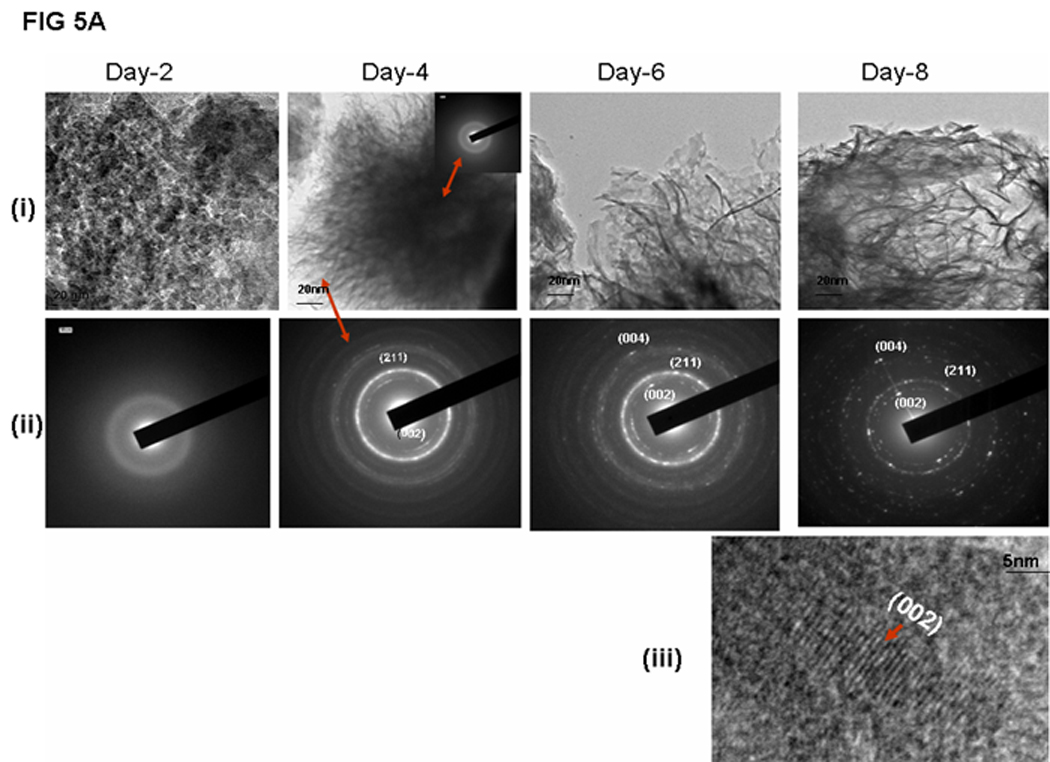
A: Characterization of the calcium phosphate deposits by TEM (i) Apatite crystallization process characterized by TEM at different days of growth. (ii) Selected Area Electron Diffraction (SAED) of the calcium phosphate deposits obtained at different growth periods, (iii) High resolution TEM showing the lattice spacing of 0.35nm corresponding to the (002) lattice plane of HAP.
B: Characterization of the calcium phosphate deposits by XRD, Raman and EDX: (i) XRD spectra obtained on calcium phosphate deposits obtained after 2,4,6 & 8 days of growth; (ii) Raman spectra obtained on calcium phosphate deposits at 2, 4, 6 & 8 days. Note shift in the wavelength from 950cm−1 to 960cm−1; (iii) Energy dispersive X-ray (EDX) spectra showing the Ca/P ratio obtained on calcium phosphate deposits from day 2,4,6 & 8 days of growth.