
Figure 6. ToF-SIMS analysis of the LZ and LZ-CDMP1 mineralized surface to identify the ion distributions in the mineralized matrix.
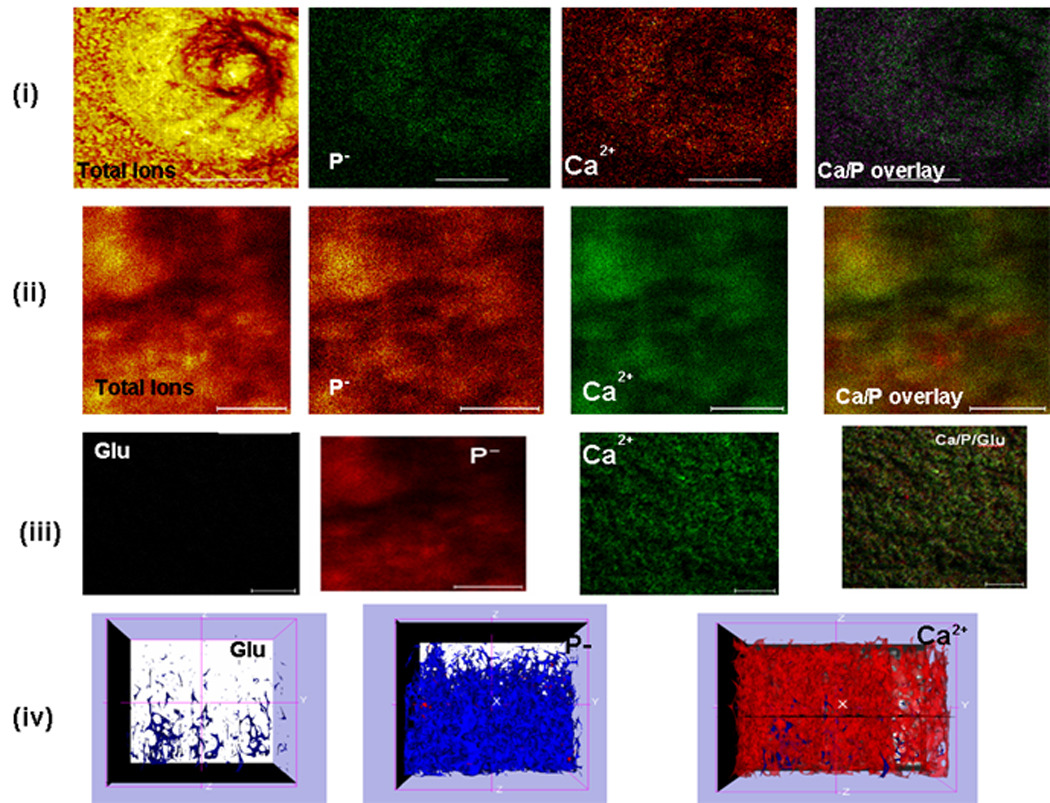
(i) Topography showing the distribution of calcium and phosphate ions deposited on LZ template after 8 days of growth; (ii) Topography showing the calcium and phosphate ion distribution on LZ-CDMP1 template after mineralization for 8 days. Note the abundance of calcium and phosphate ions; (iii) Predominant ions and amino acid fragment after 1 hour of ion etching on LZ-CDMP1 template. Note the presence of glutamic acid residue in close association with the calcified matrix. (iv) Three dimensional representation of (C) showing the colocalization of glutamic acid along with calcium and phosphate ions. Scale bar for the TOF-SIMS images is 10μm.