
Figure 18.
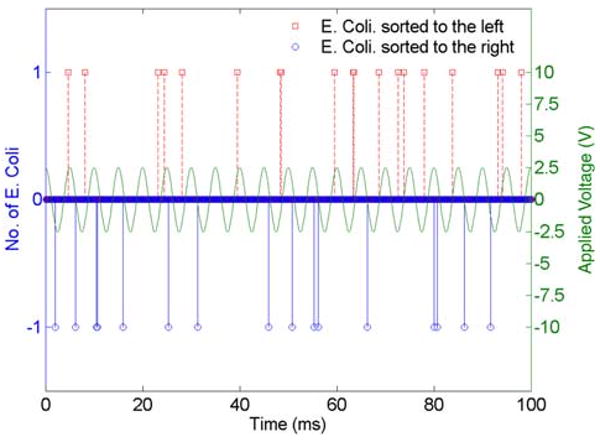
(online color at: www.biophotonics-journal.org) Results from the sorting of single E. Coli. cells at 200 Hz frequency under 5 Vp-p actuation voltage. The peaks are obtained by identifying cells visually as they are sorted to the left or right collection channels. A total of 330 cells are visually counted in 1 sec. Note that some rare peaks which appear denser mean that two cells have exited a particular collection channel at roughly the same time. Also note that time at which cells are sorted to the left or right correspond to the downward or upward (bending) ramping state; that is, these events correspond to the upward or downward slope of the applied signal on the PZT actuator, consistent with the proposed mechanism of sorting (unpublished).