
Figure 2.
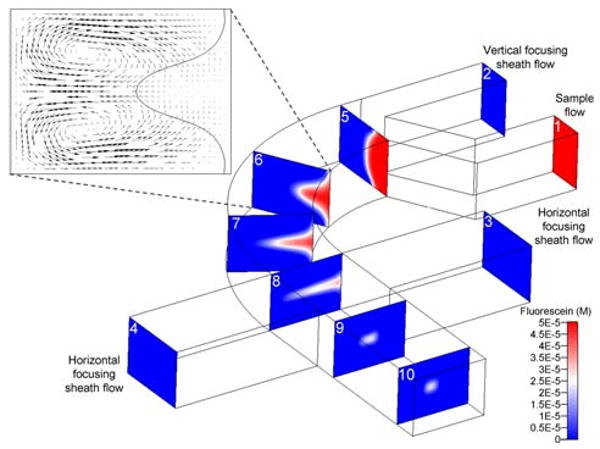
(online color at: www.biophotonics-journal.org) Schematic of the 3D hydrodynamic focusing process by employing the “microfluidic drifting” technique. Slices 1–10 are the cross-sectional profiles of the fluorescein dye concentration in the focusing device. Inset: the simulation of the secondary flow velocity field shows the formation of Dean Vortices in the 90-degreee curve. An iso-curve of fluorescein concentration = 25 μM is arbitrarily chosen as the boundary of the sample flow [42].