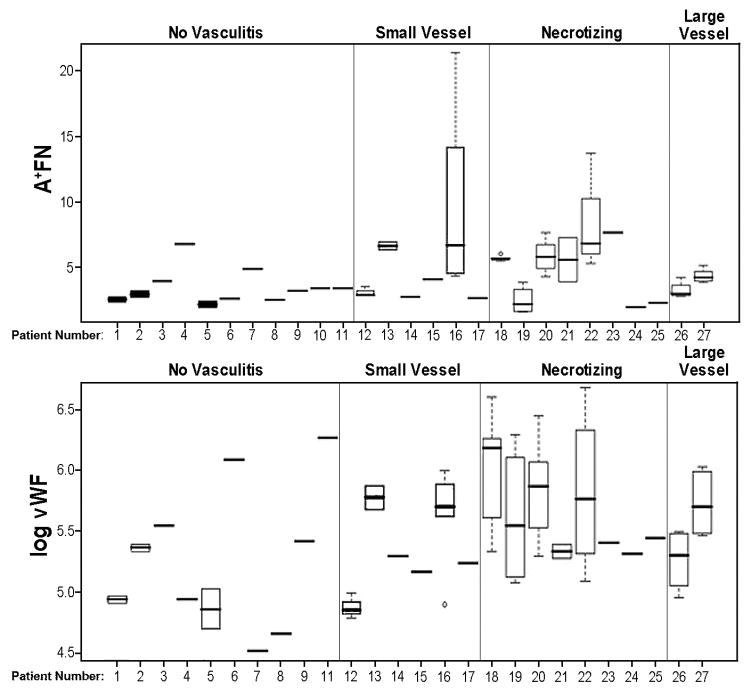
Figure 1.
Variation in plasma levels of A+FN and vWF between categories of vascular complications in SID, within category, and within person. Box plots show variation for repeated measures on same person; the ends of each box mark the 25th and 75th percentile of all observations for the person, and the whiskers show observations in the first and last quartile. Outliers are shown by open circles. Individuals with only one observation are shown by a single line segment. In A, the ordinate is A+FN concentration (micrograms/ml), whereas, in B, the ordinate is log of vWF concentration (expressed as % of average concentration in healthy controls). vWF was log transformed to stabilize variance and reduce skewness of data. Patient number 10 is missing from panel B, since no vWF concentration was available for this subject.

