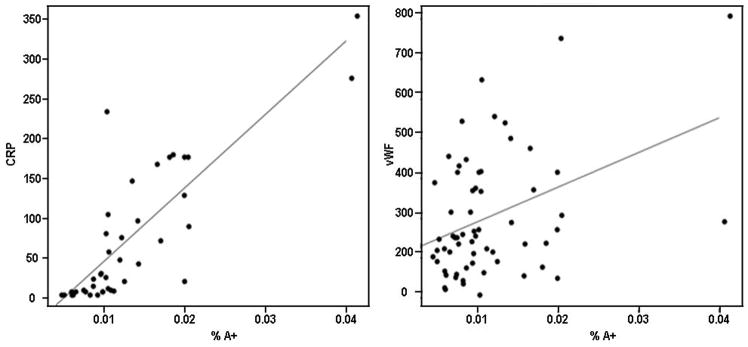
Figure 2.
Relationship between %A+, CRP and vWF in patients with SID. A. The relationship between %A+ and CRP is significant and persists after removal of outliers. B. The relationship between %A+ and vWF is significant but does not persist after removal of outliers. CRP and vWF are each expressed as the % of the average concentration in healthy controls, whereas %A+ represents the ratio of the concentration of A+FN to TFN (both in micrograms/ml).

