Fig. 4.
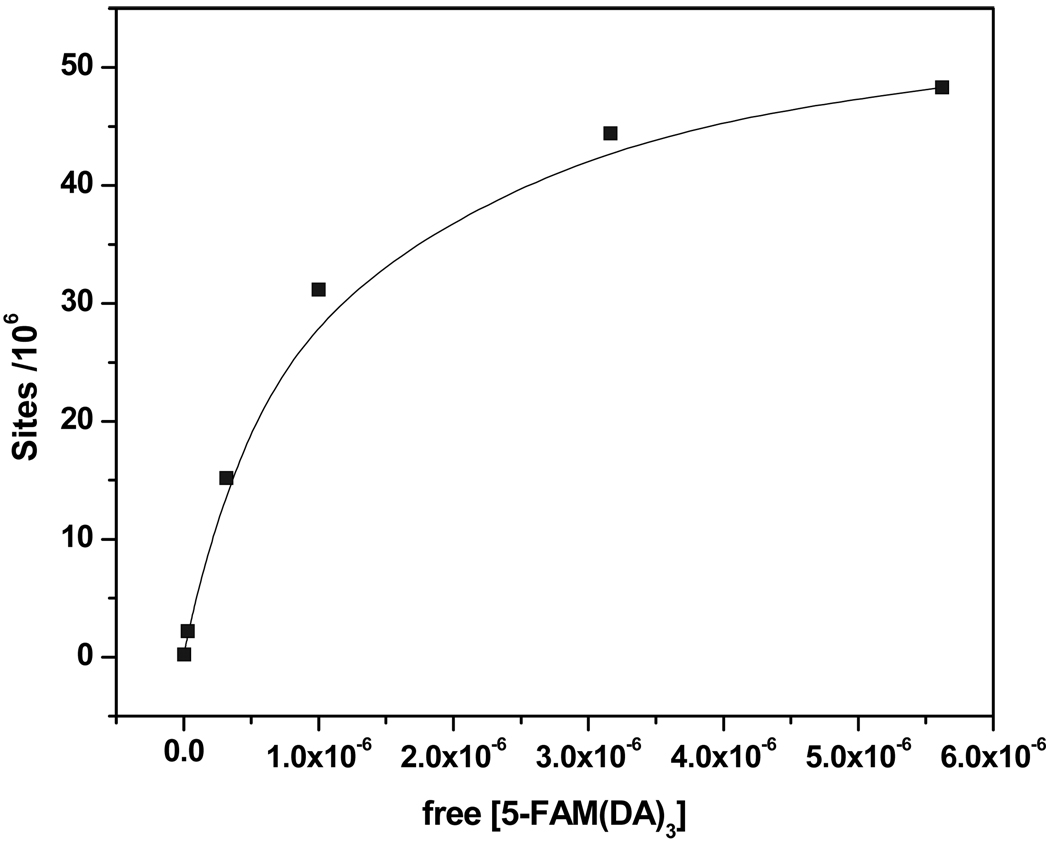
Graph of binding sites versus free 1. Number of available binding sites on microspheres was calculated using eq. (2) coverage of binding sites per bead. Data suggest ~50 × 106 available binding sites per microsphere.
Graph of number of receptor sites vs free 5-FAM(DA)3. Number of receptor sites on microspheres was calculated using equation (2) to obtain the maximum surface coverage of binding sites per microsphere. Data suggest ~50 × 106 available binding sites per microsphere.

