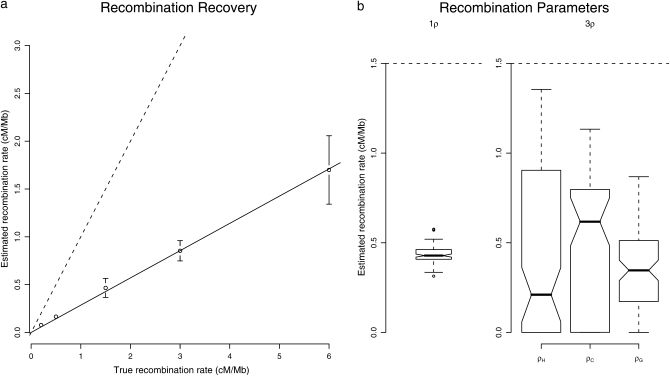
Figure 6.—
(a) Estimation of recombination rates. Ten data sets were simulated for each value of the recombination rate. The recombination rate was fixed to the same value in all lineages, and the 09 implementation with ρH = ρC = ρG was used for the estimation. Other parameters are set to the same values as in Figure 5. The dashed line shows the 1:1 ratio, and the solid line is fitted to the data. The slope is estimated to be 0.29. (b) Global vs. lineage-specific recombination rates. One hundred simulations were performed in each case, with parameter values identical to those in Figure 5. Dashed lines represent the true value of the recombination rate. Overlapping notches show nonsignificant differences in the medians.

