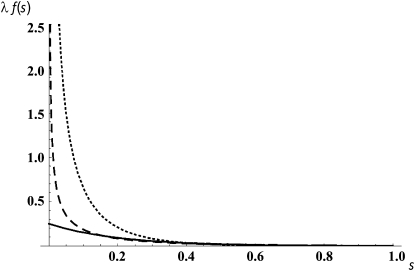
Figure 1.—
Distribution of the mutational effects (s) weighed by the mutation rate λ. For any s interval, the area under each line gives the corresponding expected number of mutations per gamete and generation with the specified deleterious effects (solid line, model I; dashed line, model II; dotted line, model III).

