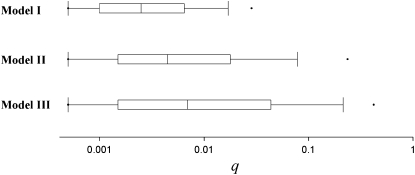
Figure 2.—
Log-scale distribution of the frequencies of nonepistatic (k = 1) mutant alleles at the base populations for each model. A line within a box marks the median. The boundary of the box closest to zero indicates the 25th percentile and that farthest from zero the 75th percentile. Whiskers left and right of the box indicate the 90th and 10th percentiles. Points indicate the 5th and 95th percentiles.

