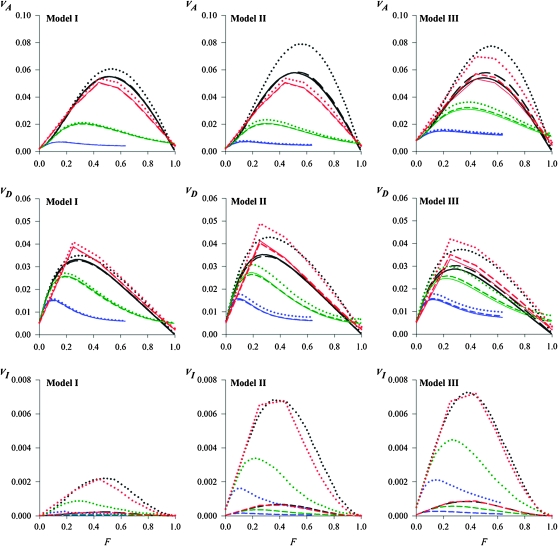
Figure 4.—
Additive (VA), dominance (VD), and epistatic (VI ) components of variance plotted against the inbreeding coefficient F after t consecutive bottlenecks of size N (red lines, N = 2; green lines, N = 10; blue lines, N = 50) for each model, scenario (black lines, D; colored lines, MSD), and type of gene action (solid lines, no epistasis, k = 1; dashed lines, moderate synergistic epistasis, k = 2; dotted lines, strong synergistic epistasis, k = 4).

