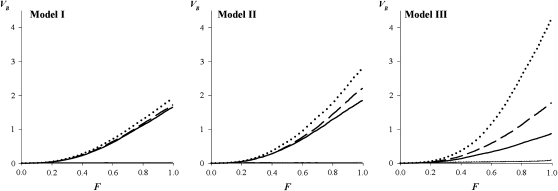
Figure 5.—
Between-line variance VB (log-scaled trait) plotted against the inbreeding coefficient F after t consecutive bottlenecks of size N = 10, for the different models, scenarios (thick lines, D; thin lines, MSD), and types of gene action (solid lines, no epistasis, k = 1; dashed lines, moderate synergistic epistasis, k = 2; dotted lines, strong synergistic epistasis, k = 4).

