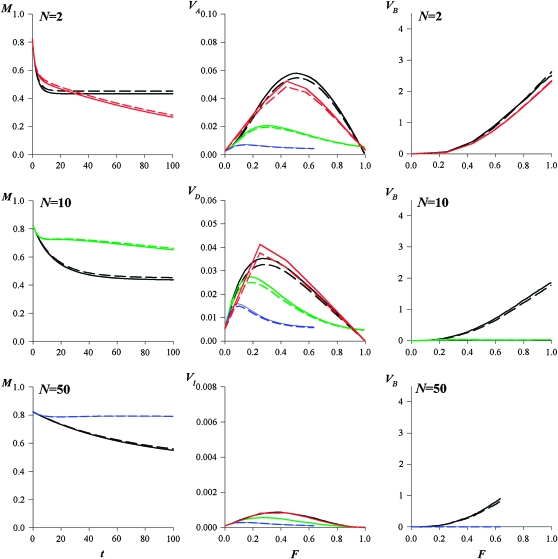
Figure 7.—
Mean fitness (M) plotted against bottleneck number (t). Additive (VA), dominance (VD), and epistatic (VI) components of variance, and between-line variance (VB), plotted against the inbreeding coefficient F after t consecutive bottlenecks of size N (red lines, N = 2; green lines, N = 10; blue lines, N = 50) for model II and each scenario (black lines, D; colored lines, MSD) and type of gene action (solid lines, no epistasis, k = 1; dashed lines, strong antagonistic epistasis, k = 0).

