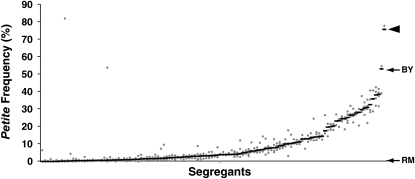
Figure 2.—
Petite frequency is a quantitative trait. A total of 122 segregants from a cross between BY4716 and RM11-1a (Brem and Kruglyak 2005) were assayed for their petite frequencies. Each shaded dot represents the petite frequency of an independent isolate of a segregant. The solid dash indicates the median petite frequency for each segregant based on all independent isolates of that segregant. Segregants are sorted in increasing order of median petite frequency. The arrows point to the median petite frequencies of the parental strains (BY4716 at 52%, RM11-1a at 0.6%). The arrowhead points to the one segregant with median petite frequency greater than that of BY4716.

