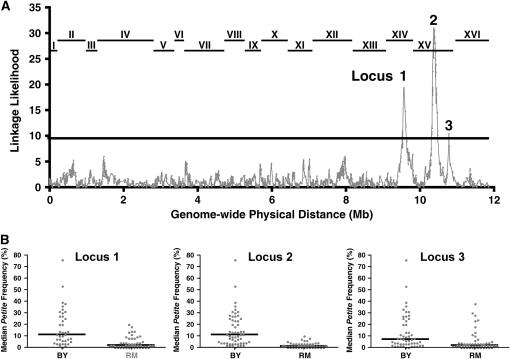
Figure 3.—
The petite frequency phenotype links to at least 3 QTL. (A) Linkage between a polymorphic marker and the median petite frequency phenotype was tested by partitioning the segregants into two groups according to marker inheritance (BY or RM). The median petite frequencies were compared between the two groups with the Wilcoxon–Mann–Whitney statistical test (Lindgren 1968). The P-value of that test was transformed by taking the negative value of the natural logarithm of the P-value. The shaded line plots the transformed P-value (y-axis) for each marker as a function of the physical location of the marker in the yeast genome (x-axis). The lines at the top of the graph indicate the locations of the 16 S. cerevisiae chromosomes. The solid line at linkage likelihood of 9.3 marks the 5% genomewide significance level, which is adjusted for multiple testing on the basis of empirical permutation tests (Churchill and Doerge 1994). The three loci that reach statistical significance are designated as loci 1, 2, and 3. (B) The median petite frequencies are presented for segregants with unequivocal inheritance at the three loci shown in A of either the BY or the RM parent. For locus 1, analysis was restricted to the 100 segregants with no missing genotype data and no recombination events in the 37.2-kbp window between marker positions 449,639 and 486,861, which are the two markers with the highest linkage likelihood. For locus 2, analysis was restricted similarly to 114 segregants in a 26.4-kbp window (between marker positions 519,776 and 546,197). For locus 3, analysis was similarly restricted to 108 segregants in an 8.7-kbp window between marker positions 937,036 and 945,781, which are the two markers with the highest linkage likelihood.

