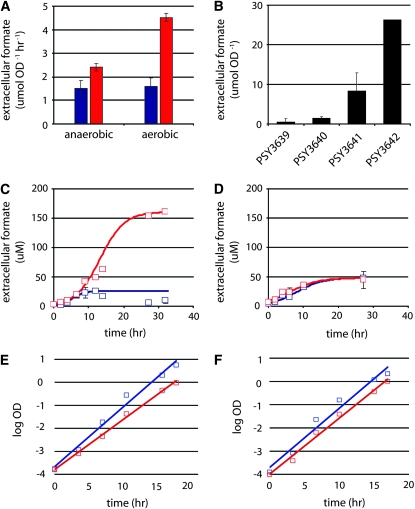
Figure 2.—
Experimental validation of model predictions. (A) Formic acid secretion rates under aerobic and anaerobic growth conditions; (B) total extracellular formic acid production for several strains, including PSY3639 (blue) and PSY3642 (red), grown aerobically (C) and anaerobically (D). Growth rates are given for PSY3639 and PSY3642 grown aerobically (E) and anaerobically (F). Genotypes for strains in B are listed in Table 2. Fit curves in C–F were calculated using logistic regression. Data represent the average of three biological replicates ± SD. A paired two-tailed t-test was used to test for statistical significance in A.

