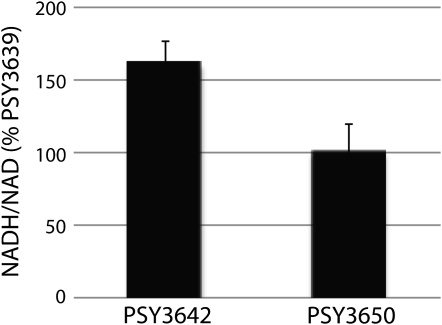
Figure 5.—
Increase in NADH/NAD in PSY3642 NADH/NAD ratios for PSY3642 and PSY3650 is given as percentage of PSY3639. Data represent the average of four biological replicates ± SD. Compared to that in PSY3639, NADH accumulated significantly in PSY3642 (P = 0.001) but not in PSY3650 (P = 0.46). Statistical significance was assessed by testing the null hypothesis m = 100% vs. the alternative m > 100%, assuming normally distributed sample data.

