Figure 5.

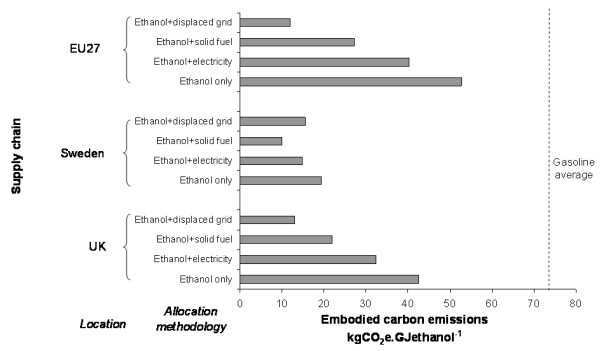
The variation in embodied carbon emissions estimates for alternative allocation methods and locations. The example shown is for the spruce enzymatic hydrolysis supply chain (Spruce-EH).

The variation in embodied carbon emissions estimates for alternative allocation methods and locations. The example shown is for the spruce enzymatic hydrolysis supply chain (Spruce-EH).