
Figure 9.
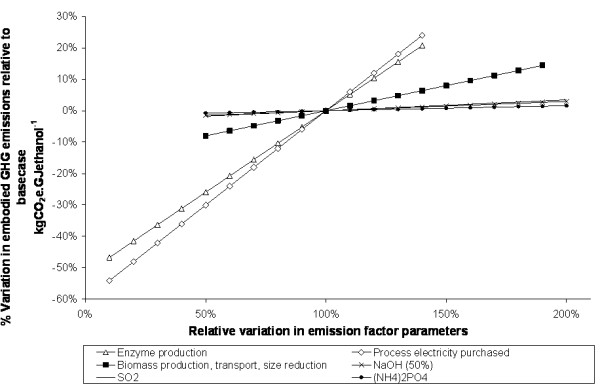
The sensitivity of supply chain greenhouse gas performance to variations in emission factor assumptions – softwood enzymatic process. The example shown assumes EU27 electricity, and that emissions are allocated to ethanol and solid fuel in proportion to their energy content.