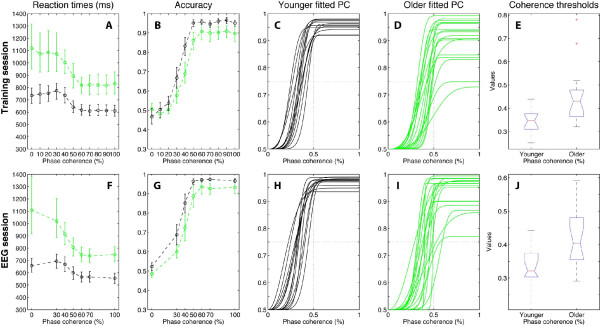
Figure 3.
Behavioural results in the training (upper row) and the EEG (lower row) sessions. Green = older, black = younger. Error bars = 95% confidence intervals. The third column shows the individual percent corrects (PC) (averaged across subjects in column two) fitted by cumulated Weibull functions. Stimulus phase coherences necessary to reach a threshold performance of 75% correct were obtained from the Weibull fits, and are shown as boxplots for younger and older observers in the last column. In a boxplot, the red line indicates the median. The blue box extends from the upper to the lower quartile values. The whiskers show the most extreme points that are within 1.5 times the inter-quartile range. A red plus is an outlier. The notch in the blue box corresponds to a robust estimate of the median confidence interval. Non-overlapping notches indicate that medians differ with 95% confidence.

