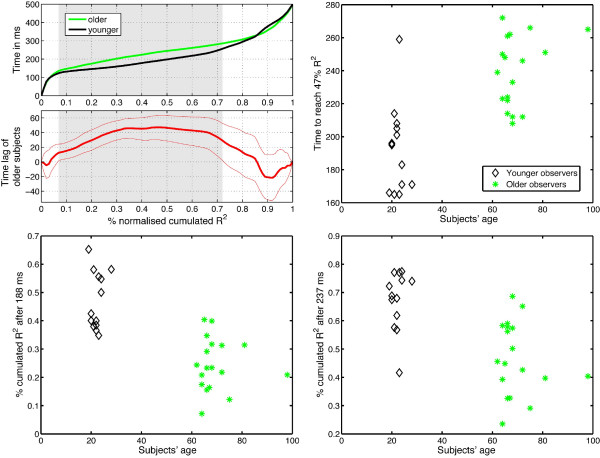
Figure 8.
Processing time thresholds. The upper left quadrant shows the mean time in ms (y axis) necessary to reach a given percentage of the normalised cumulated R2 time course (x axis) for younger (black) and older (green) observers. The difference between the two groups is plotted in thick red lines, with the 95% confidence interval in thin red lines. When the difference does not contain zero, the difference is significant, which is indicated by the grey areas. After the younger subjects had accumulated 47% of their R2 distribution, they leaded the older group by 47 ms. The time necessary to reach 47% is shown in the upper right quadrant for individual subjects. The percentage of the R2 distribution accumulated after 188 ms and 237 ms are indicated in the lower quadrants. See text for explanations.

