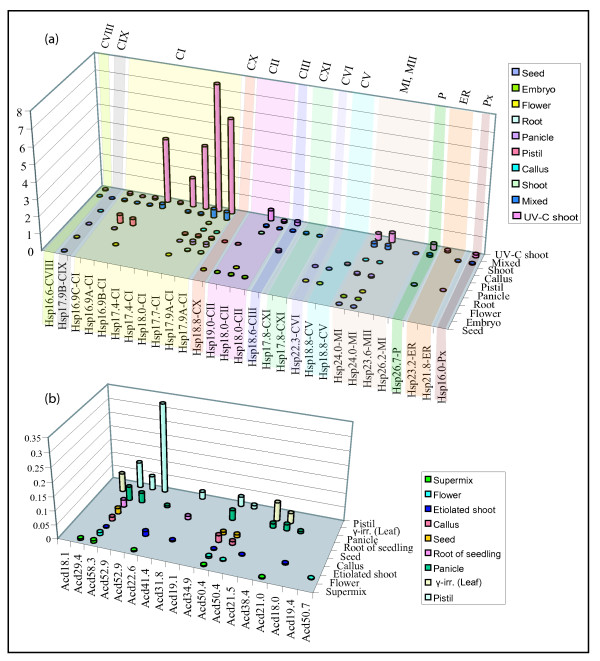
Figure 4.
EST analysis of sHsp and Acd genes of rice. EST based expression of sHsp genes (a) and Acd genes (b). The details of the libraries are given in 'methods'. The library for each tissue is not same for each gene. Expression of sHsps and Acd genes is plotted as percent frequency i.e. (number of ESTs for particular gene/total number of ESTs in the library). γ-irr; gamma irradiated.

