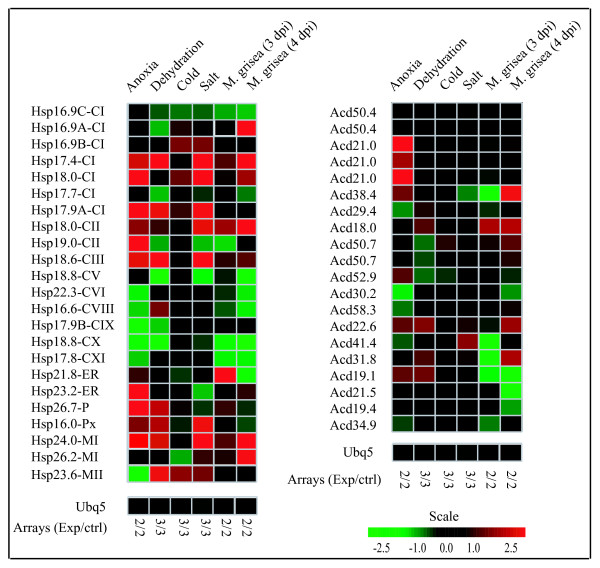
Figure 6.
Expression pattern of sHsp and Acd genes under various stress conditions. The microarray data based expression profiles under stress conditions are presented as heat maps generated using meta-analysis tool at Genevestigator http://www.genevestigator.ethz.ch. The transcript levels are depicted by color scale indicating log2 values. Ubq5 expression is shown as control.

