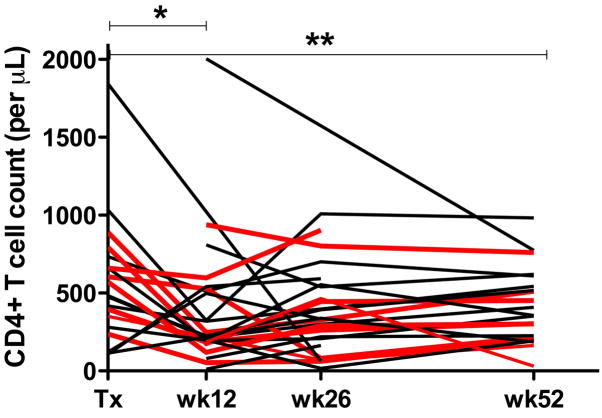
Figure 1. CD4+ T-cell-counts in HIV(+) kidney transplant recipients before and at 12, 26, and 52 weeks post-transplantation.
Counts are expressed as CD4+ T-cells per μL of peripheral blood. Each line represents one individual, red lines represent individuals that were treated with ATG. Note the significantly lower CD4+ T-cell counts at week 12 (* p<0.05) and week 52 (** p<0.01, [Wilcoxon signed rank]) compared to pre-transplantation levels.

