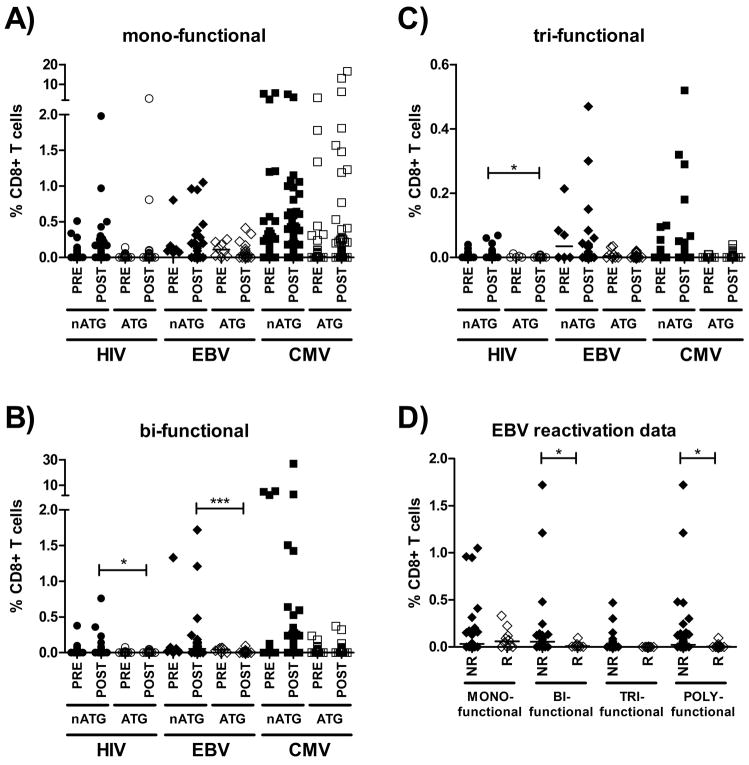
Figure 4. Impact of ATG-treatment on the individual frequency of mono-, bi- and tri-functional HIV-, EBV- and CMV-specific CD8+ T-cells pre- and post-transplantation and the occurrence of EBV-reactivation post-transplantation in HIV(+) kidney transplant patients.
Panel A) shows individual frequencies of mono-functional) HIV-, EBV- and CMV-specific CD8+ T-cells over time in transplant recipients that were treated with or without ATG (labeled “ATG” and “non-ATG”, respectively). Similarly, panels B) and C) represent individual frequencies of bi- and tri-functional virus-specific CD8+ T-cells in the same groups. Panel D) shows individual frequencies of EBV-specific CD8+ T-cells with the indicated level of polyfunctionality that where measured at the time of an EBV-reactivation event or conversely, at time points that were not followed by any reactivation event. Horizontal lines indicate medians. * p<0.05; *** p<0.001. Closed symbols represent non-ATG-treated individuals, while open symbols represent ATG-treated individuals. Abbreviations: PRE: pre-transplantation; POST: post-transplantation; nATG: non-ATG treated individuals; ATG: ATG-treated individuals; NR: individuals for whom no EBV-reactivation was observed; R: individuals that reactivated EBV-replication.

