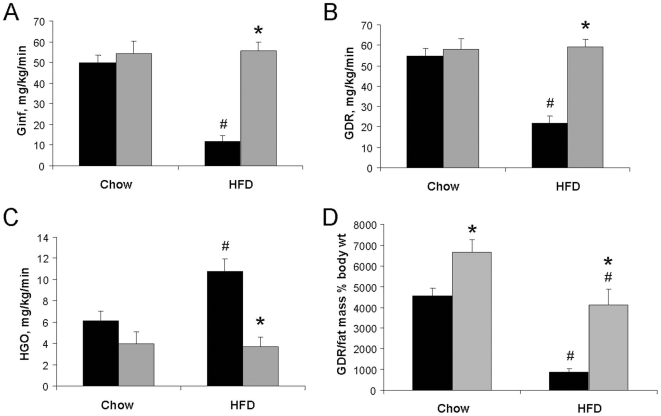
Figure 4. Characterization of whole body insulin sensitivity.
Hyperinsulinemic euglycemic clamp studies were conducted to calculate (A) Ginf, (B) GDR, (C) HGO, and (D) GDR normalized to fat pad mass as a percent of body weight in WT (black bars) and 12/15LO KO (gray bars) mice fed NC or two-week HFD. Values are mean±standard error. 7–9 animals per group. *p<0.05 vs WT HFD, #p<0.05 vs WT NC.

