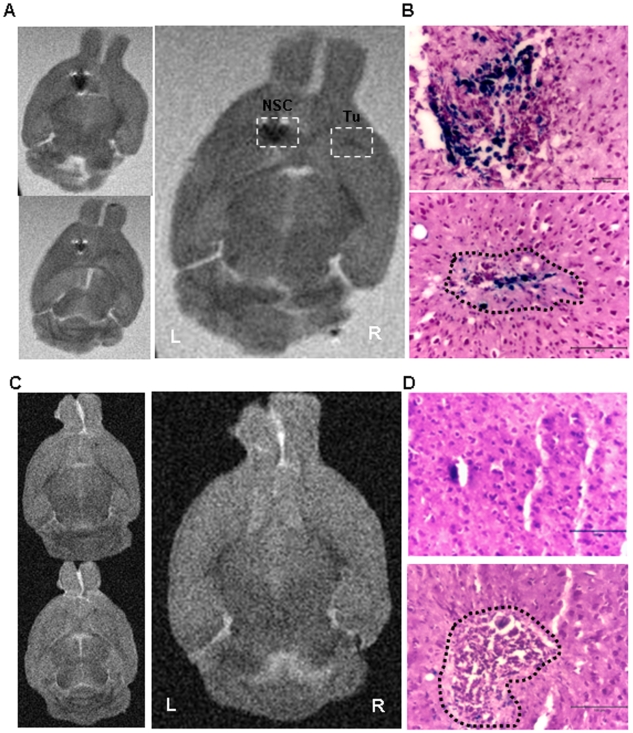
Figure 4. MRI Visualization of FE-Pro-labeled NSCs targeting human glioma in an orthotopic mouse model.
(A) Consecutive T2-weighted MR images of mouse brain in 30% sucrose and 4% PFA. FE-Pro-labeled NSCs are shown as hypointense (dark) signals (white dotted boxes) in the left hemisphere and in the contralateral right hemisphere, where human U251 glioma cells were implanted. (B) Higher magnification, Prussian blue stained sections from the areas outlined by the boxes in (A) (top, left hemisphere; bottom, right hemisphere, tumor area outlined by black dotted line). (C) Consecutive T2-weighted MRI images of mouse brain in Fomblin that received PBS sham injection on left hemisphere and human glioma U251 on the right hemisphere. No low-intensity signals were detected in this control. (D) Higher magnification, Prussian blue stained sections from the areas outlined by the boxes in (C) (top, left hemisphere; bottom, right hemisphere, tumor area outlined by black dotted line). MRI conditions: 7.0 Tesla, Rapid Acquisition Relaxation Enhancement sequence, 78 µm/pixel, 300 µm/slice, TR/TE = 1500/23.1 ms. Scale bars = 100 µm (B and D).

