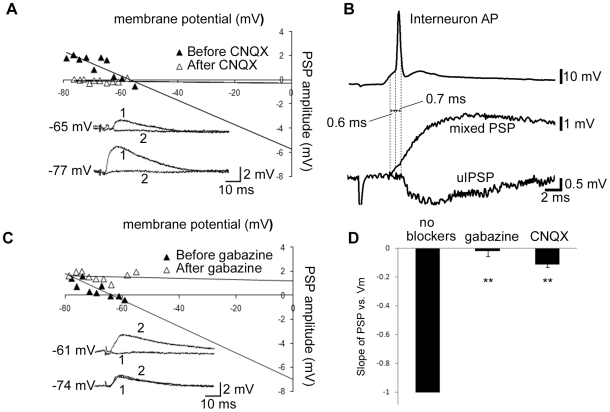
Figure 1. Feedforward inhibition reduces EPSP amplitude.
A, PSP amplitude vs. Vm for one cell before and after CNQX. Inset: Sample traces before (1) and after (2) CNQX application. B, sample traces demonstrating the delay between the evoked pyramidal PSP and interneuron AP, and the delay between the interneuron AP and unitary IPSP (note that the intracellularly evoked interneuron AP, which produced the uIPSP, has been omitted for clarity). The PSP was recorded from a membrane potential of −82 mV; the uIPSP was recorded from a membrane potential of −48 mV. C, left, PSP amplitude vs. Vm for one cell before and after gabazine. Inset: Sample traces before (1) and after (2) gabazine application. D, The slope of the PSP vs. Vm graph before and after either gabazine (n = 4) or CNQX (n = 29), normalized to the before drug slope. ** denotes statistical significance from ctrl (no blockers; ** p<0.001). Membrane potential denoted to left of sample traces in A and C.

