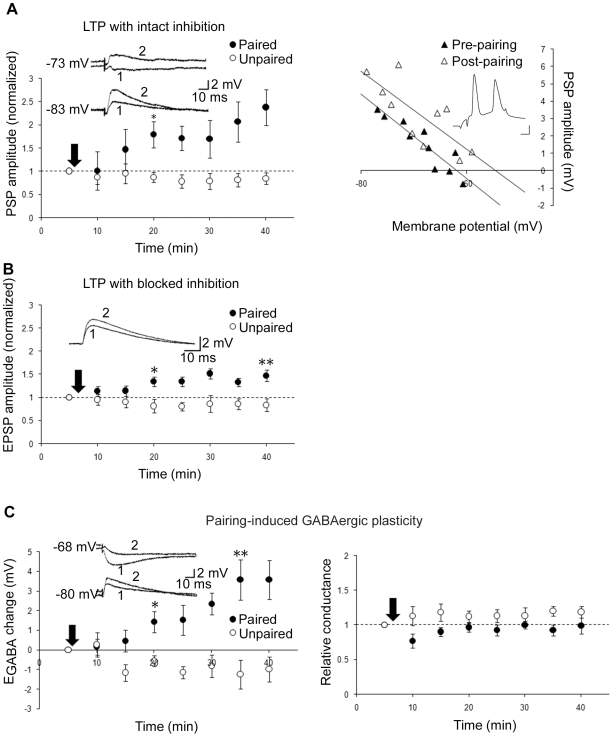
Figure 2. EGABA depolarization underlies a large component of mixed LTP.
A, Left: Mixed LTP (pairing n = 6, ctrl n = 5). Inset: Sample traces before (1) and after (2) paired activity at two holding potentials. Right: Sample PSP vs. membrane potential plots for one cell before and 35 min after pairing. Inset: example of one pairing demonstrating timing of presynaptic stimulation and action potential firing. Scale bars: 20 mV, 2 ms. B, glutamatergic LTP (pairing n = 7, ctrl n = 5; gabazine present throughout recording). Inset: Average of 10 traces before (1) and after (2) paired activity. C, GABAergic plasticity: change in EGABA (left) and conductance (right; pairing n = 6, ctrl n = 5, same cells left and right; CNQX present throughout recording; NMDARs left unblocked). Inset: Sample traces before (1) and after (2) paired activity, at two holding potentials. * and ** denote statistical significance from control (p<0.05 and p<0.001, respectively) from that time point on. Arrows denote plasticity induction.

