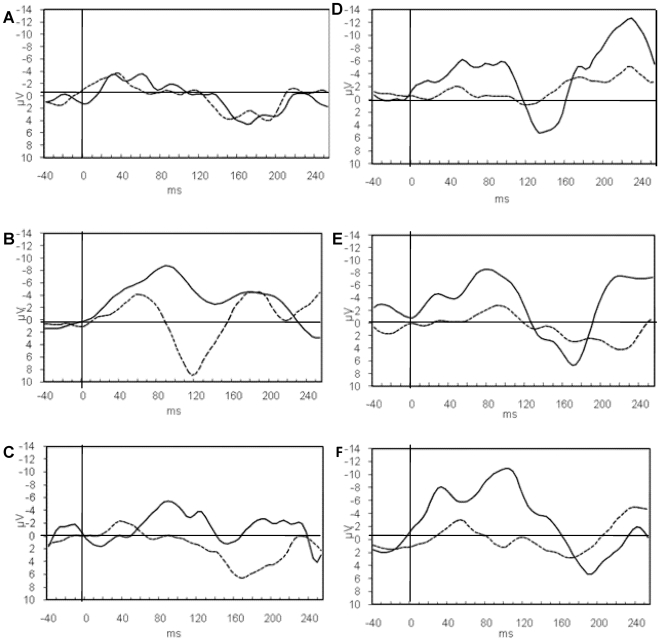
Figure 2. ERN and CRN amplitudes in tests 1, 2 and 3 in dyslexics and controls.
A grand average for the ERN-CRN (response-locked) components for correct response (CRN) and for error response (ERN), represented by the dashed and the solid lines, respectively, for tests 1 (A,D), 2 (B,E) and 3 (C,F) in dyslexics (left column, A,B,C) and controls (right column, D,E,F) at the Cz electrode. The ERN is seen between 30 and 150 ms after response denoted by the vertical line at time 0. Note that the negative Y axis is plotted up.

