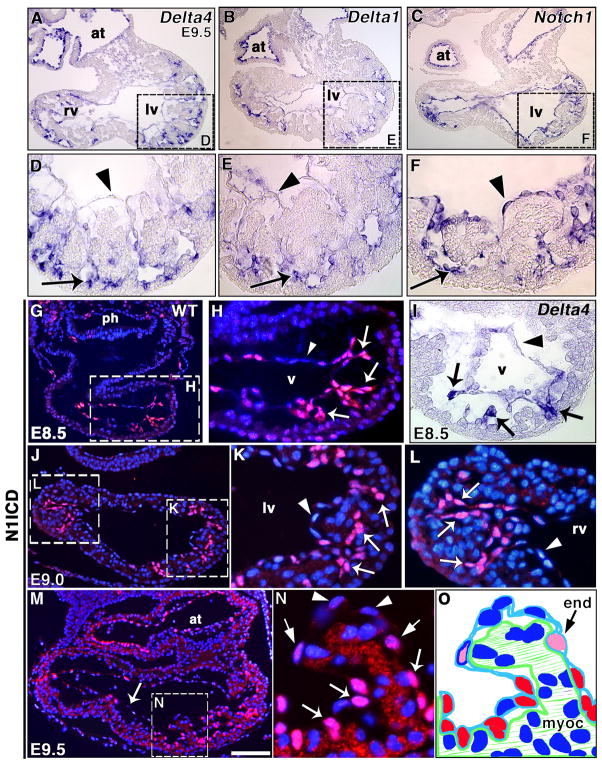
Figure 1. Notch is active in the developing trabeculae.
(A–F) Delta4, Delta1 and Notch1 transcription in E9.5 wt heart by WISH. Delta4 (A, D) and Delta1 (B, E) transcribe preferentially in the endocardium at the base of trabeculae (arrows); little or no transcript is detected in distal endocardium (arrowheads). Notch1 (C, F) is uniformly transcribed in ventricular endocardium (arrow and arrowhead). (G–N) N1ICD staining (red), nuclei counterstained with DAPI (blue). (G, H) General heart view at E8.5 (G) and detail of ventricle (H). Note strong N1ICD expression in endocardium at the base of presumptive trabeculae (arrows) and no signal in distal endocardium (arrowhead). (I) Delta4 transcription at the base of nascent trabeculae (arrows) at E8.5. (J) E9.0 general heart view; note strong N1ICD staining in both ventricles. (K, L) Left (K) and right (L) ventricles with strong N1ICD staining in endocardium at the base of trabeculae (arrows), and no signal in distal endocardium (arrowhead). (M) E9.5 general heart view, strong N1ICD expression in ventricles and atrium, weaker expression in interventricular endocardium (arrow). (N) Detail of trabecula in left ventricle. Note strong N1ICD expression at the base (arrows) and progressively reduced signal at the middle (thin arrows) and distal tip (arrowheads). (O) Schematic representation of the trabecula shown in (N). The red color indicates strong N1ICD staining and the pink color indicates weak staining. at, atrium; end, endocardium; myoc, myocardium; ph, pharynx; lv, left ventricle; rv, right ventricle; v, ventricle. All panels are transverse sections. Scale bar, 100 μm in A–C, G, J, M; 25 μm in D–F, H, I, K, L; 80 μm in G; 15 μm in N.

