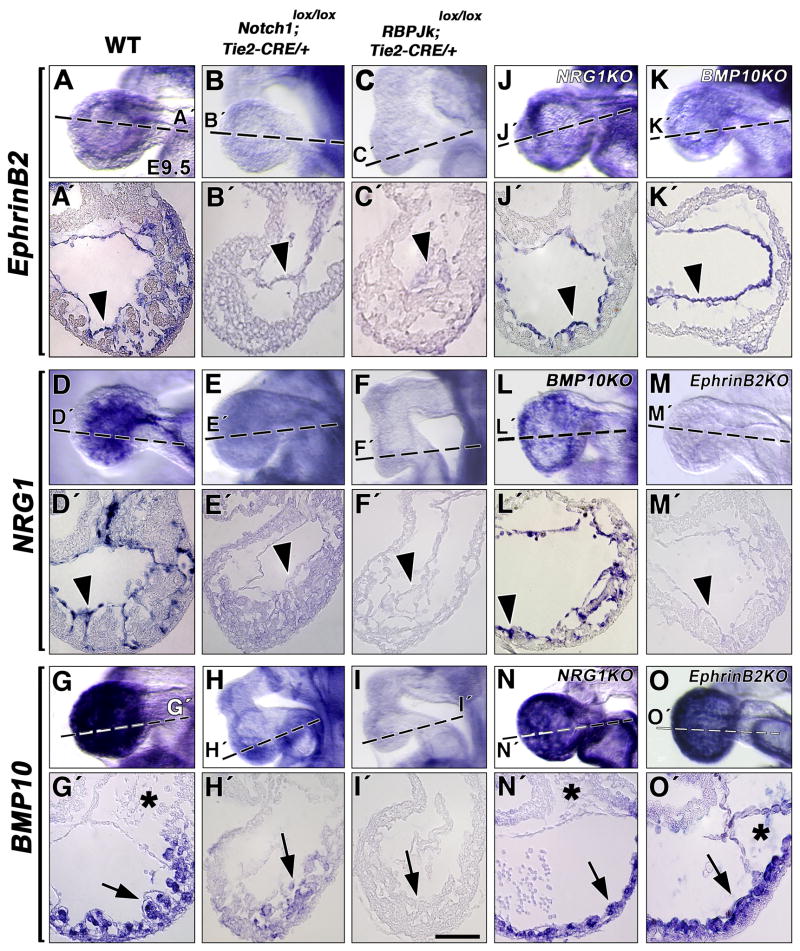
Figure 4. Expression analysis in endocardial-specific Notch mutants and standard targeted EphrinB2, NRG1 and BMP10 mutants.
WISH, E9.5. (A, A′) EphrinB2 expression in wt embryos; reduction in Notch1lox/lox; Tie2-CRE (B, B′) and RBPJklox/lox; Tie2-CRE (C, C′) mutants. (D, D′) NRG1 expression in wt; reduction in Notch1lox/lox; Tie2-CRE (E, E′) and RBPJklox/lox; Tie2-CRE (F, F′) mutants. (G, G′) BMP10 expression in wt; reduction in Notch1lox/lox; Tie2-CRE (H, H′) and RBPJklox/lox; Tie2-CRE (I, I′) mutants. Normal EphrinB2 transcription in E9.5 NRG1 (J, J′) and BMP10 mutants (K, K′). Normal NRG1 expression in BMP10 mutants (L, L′) and marked reduction in EphrinB2 mutants (M, M′). BMP10 expression in NRG1 (N, N′) and EphrinB2 (O, O′) mutants. Arrowheads point to endocardium and arrows to myocardium. Asterisks indicate endocardial cushion of the AV canal, devoid of mesenchymal cells in EphrinB2 mutants. Scale bar, 25 m.

