
Figure 3.
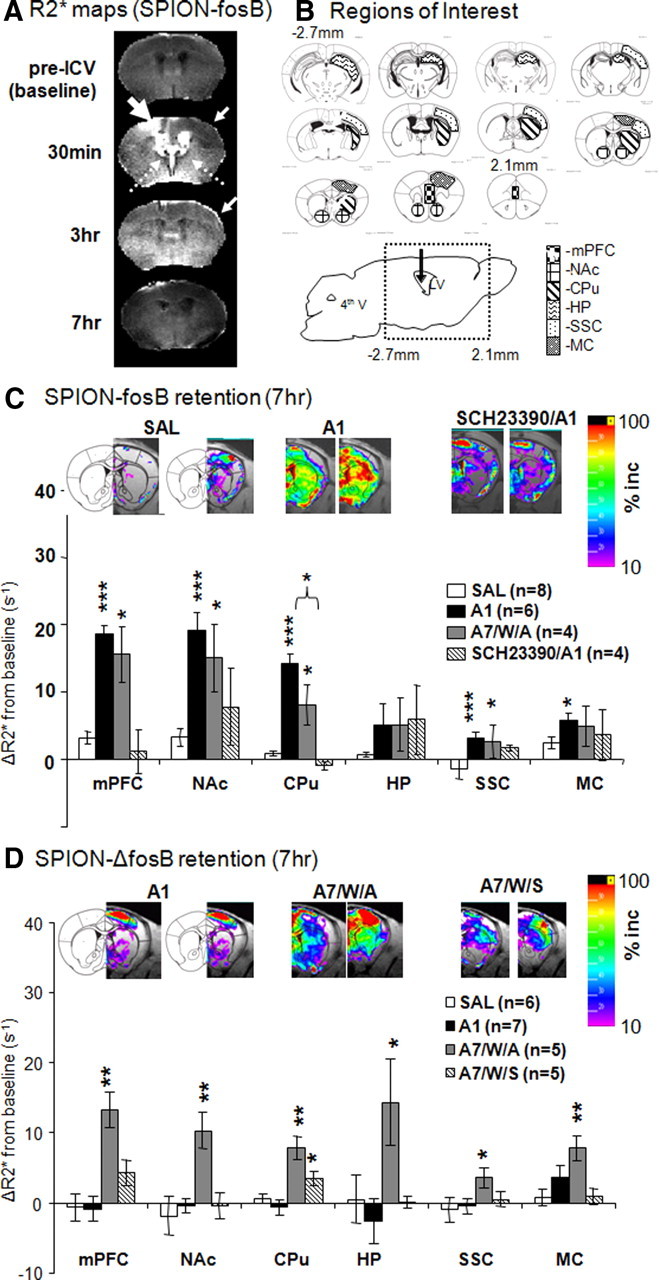
Distribution and retention of SPION-fosB and SPION-ΔfosB probes in vivo. A compares the R2* maps (caudal view) obtained from live animals at four time points referenced to ICV infusion of SPION-fosB probe. A thick arrow points to the site of ICV infusion. B depicts outlines of ROI for statistical analyses (Paxinos and Franklin, 2001). These regions include the mPFC, NAc, and CPU, HP, somatosensory (SSC), and MC. C shows quantitative analyses of fosB expression in ROI from R2* maps of acute and chronic AMPH in this study. Representative SPION-fosB signal maps are presented above the bar graph based on the following equation and signal cutoffs are 10–100%: ΔR2* = (R2* − R2*baseline)/R2*baseline× 100%. We observed significantly reduced fosB mRNA induction in the CPU after AMPH challenge dose after chronic AMPH exposure and a period of no drug (p = 0.03). D shows quantitative analyses of ΔfosB expression in ROI of SAL, acute AMPH exposure (A1), or chronic AMPH with challenge (A7/W/A) and without challenge (A7/W/S). Significant level (compared with the group received saline); *p < 0.05, **p < 0.01, ***p < 0.001.