
Fig. 3.
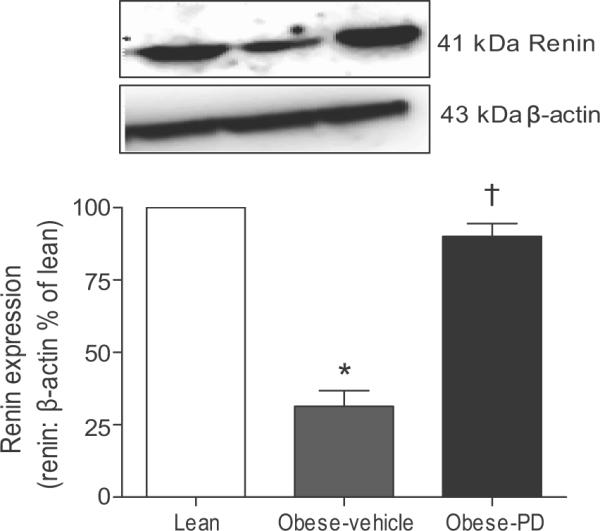
Expression of renin in the kidney cortex of lean, obese vehicle and PD 123319-treated obese Zucker rats. Upper panel: Representative western blot of renin and β-actin. Lower panel: Bar graphs with values of renin band density normalized with β-actin as loading control. *significantly different compared with lean rats, † significantly different compared with obese control rats. (One way ANOVA, p<0.05, n=5 in each group).