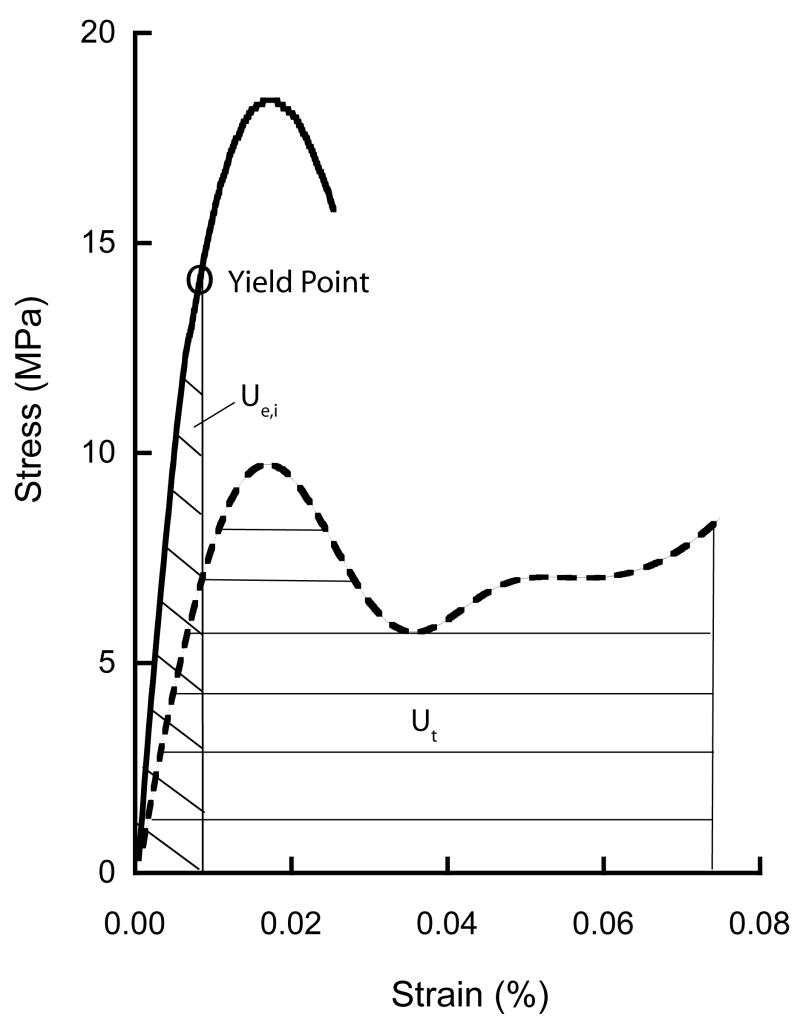
Figure 2.
Representative curve of stress-strain behavior for typical on-axis specimen subject to initial overload of 2.5% strain (solid line) and then to failure of 7.5% strain (dashed line). The initial elastic toughness (Ue,i) and toughness to 7.5% strain (Ut) are indicated by shading on the graph. Ue,i was measured using the yield strain based on the 0.2% offset method.

