
Fig. 1.
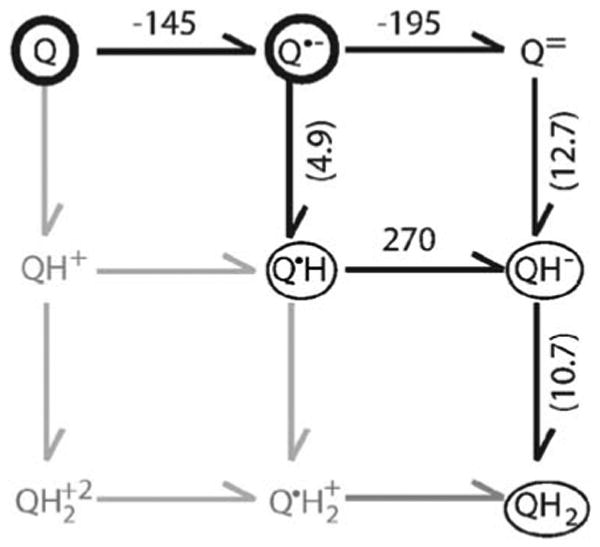
The Ems on the horizontal arrows are in millivolt. The pKas, are in parenthesis on the vertical arrows. The quinone species in the dark circles are found in both the QA and QB sites. Thin circles indicate species found only in the QB site. The species in grey are not seen in RCs or in aqueous solution as they are expected to have pKas below pH 0. All values are taken from (Zhu and Gunner 2005, see references therein)