
Figure 1.
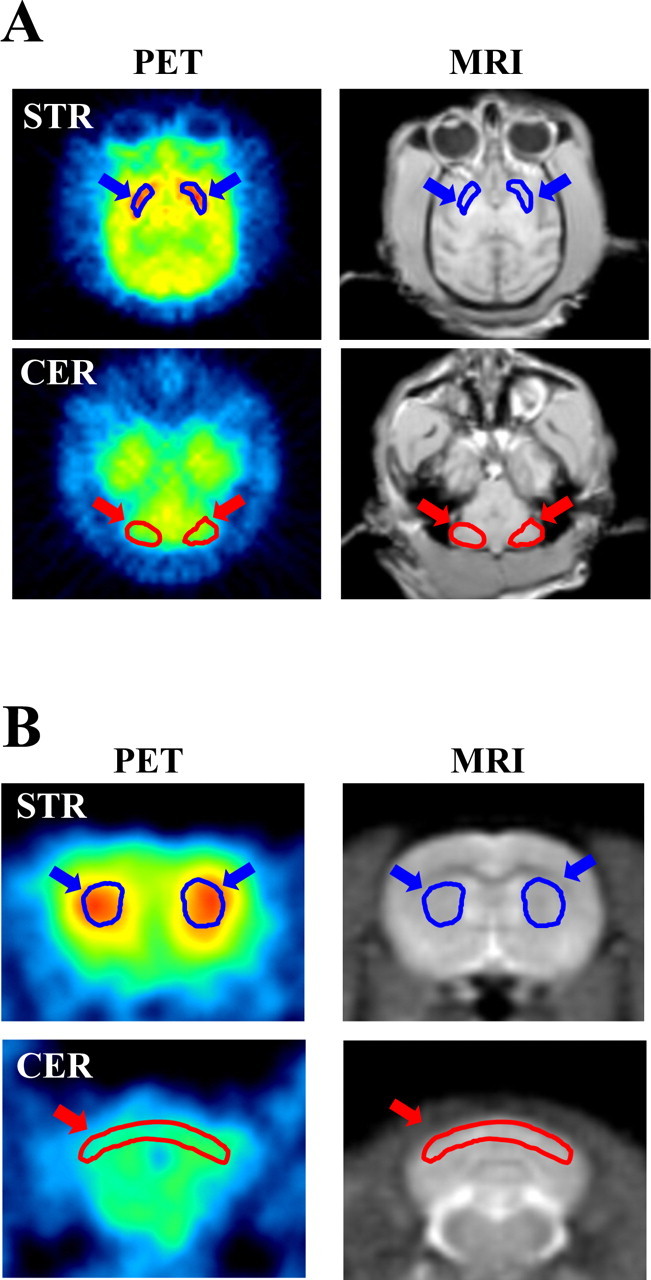
Distribution of [11C]MNPA in cynomolgus monkey (A) and rat (B) as viewed by PET. Transaxial (A) or coronal (B) MR images (MRI) at different levels were used for defining ROIs on the striatum (STR) and cerebellum (CER), as indicated by blue and red arrows, respectively. The ROIs were then translated to the coregistered PET images to generate regional time-radioactivity curves. The PET images displayed here reflect the radioactivity summed from 0 to 90 min after tracer injection.