
Figure 6.
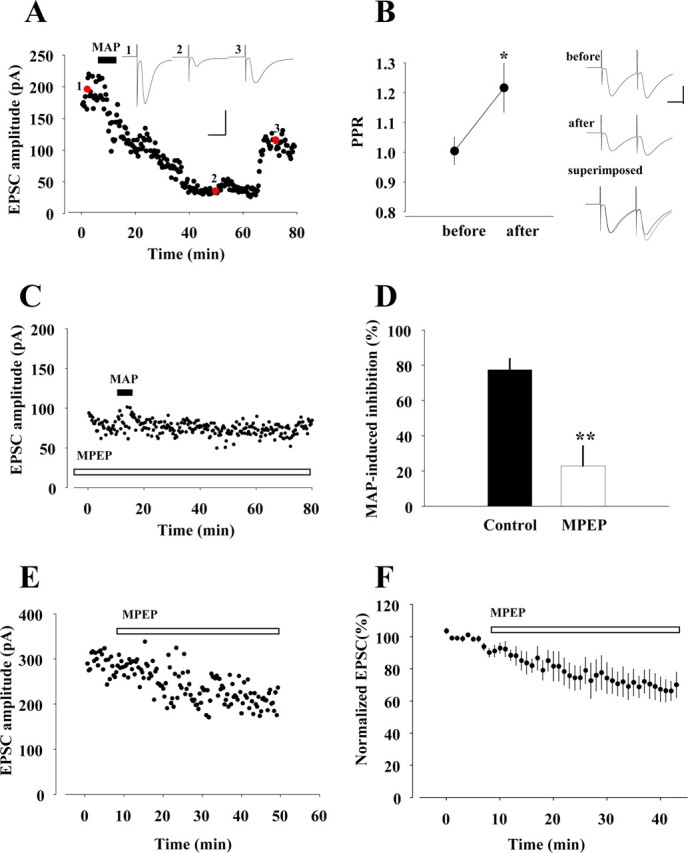
Effects of MPEP on inhibition of EPSCs induced by methamphetamine (MAP). A, Effect of MAP (100 μm; filled bar) on EPSCs. Traces 1–3, taken at time points indicated by red circles, are representative EPSCs before, during, and after the application of MAP, respectively. Calibration: 100 pA, 20 ms. B, Left, Averages of PPRs before and during methamphetamine application (n = 4). *p < 0.05, paired Student's t test. Right, EPSCs elicited by two successive stimuli at an interval 50 ms before and during MAP application. Each trace is the average of 12 consecutive traces. In the superimposed trace, initial EPSCs during methamphetamine application were normalized to those recorded under control conditions. Calibration: 100 pA, 20 ms. C, Effect of pretreatment of MPEP (100 μm; open bar) on MAP-induced attenuation of EPSCs. D, Summarized comparative histograms showing effects of MAP alone (n = 5) and MPEP combined with MAP (n = 4). **p < 0.01, unpaired Student's t test. E, Amplitude of EPSCs after bath application of MPEP alone. F, Normalized EPSC amplitudes plotted before and during application of MPEP.