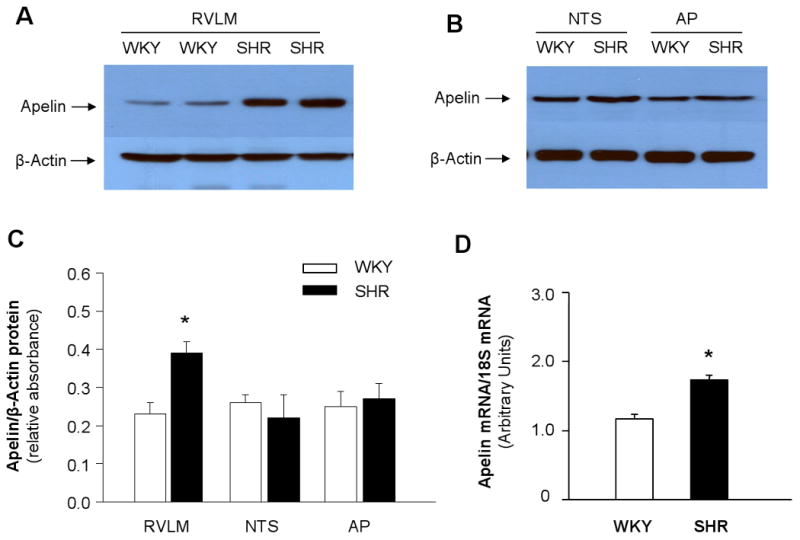
Figure 1. Expression of apelin is enhanced in the RVLM of SHR rats.

A) Representative autoradiogram of apelin protein levels in the RVLM: Western blot analysis was used to measure apelin levels from 20 μg of total cell lysate isolated from RVLM micropunches of SHR and WKY rats. Data are normalized using β-actin. B) Representative autoradiogram of apelin protein levels in the NTS and AP of SRH and WKY rats as described in (A). C) Bar graphs summarizing the quantitation of the apelin protein bands. Data are mean ± SE of apelin vs. β-actin protein in the RVLM, NTS, or AP of SHR or WKY rats (n=4 in each strain). *P<0.05 compared with apelin protein levels in the RVLM of WKY rats. D) Bar graphs showing the mRNA levels of apelin in the RVLM of SHR and WKY rats. The apelin mRNA levels were detected using real-time RT-PCR. Data are mean ± SE fromSHR and WKY rats (n=4 in each strain). *P<0.05 compared with apelin mRNA levels in WKY rats.
