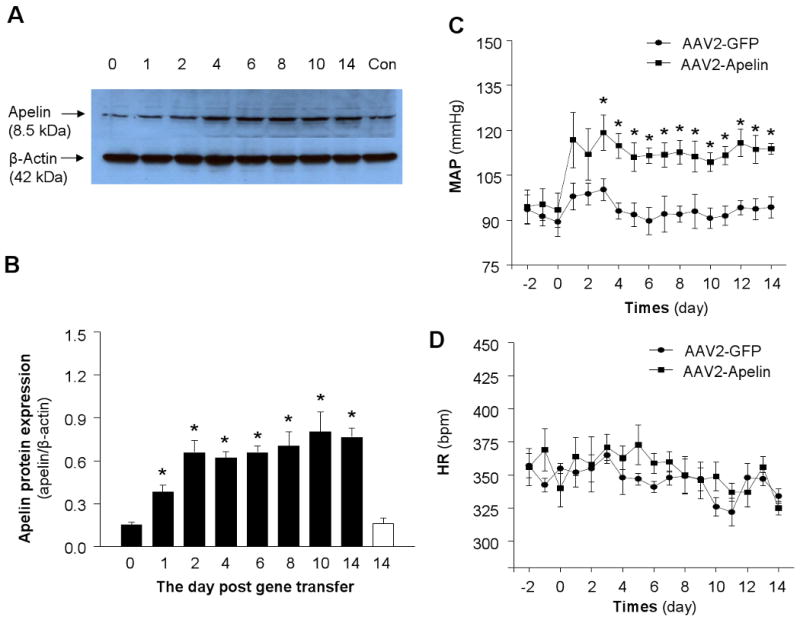
Figure 3. Apelin levels in the RVLM after apelin gene transfer and effect of overexpression of apelin in the RVLM on blood pressure and heart rate.

A) Representative autoradiogram of apelin levels in the RVLM. Western blot analysis was used to measure apelin protein levels in RVLM micropunches from brain sections of WKY rats at the time points indicated in the figure after AAV2-Apelin or AAV2-GFP control injection. The β-actin protein levels in each sample are shown in the lower panel of the figure. B) Bar graphs summarizing the apelin levels in the RVLM at the day indicated in the figure after bilateral microinjection of either AAV2-Apelin (black bar) or AAV2-GFP control (open bar). The apelin levels were measured in rat RVLM micropunches using Western blots. Data are normalized to β-actin protein. Data are means ±SE (n=4 rats for each group). *P<0.05 compared with control group. C-D) AAV2-Apelin or AAV2-GFP was injected bilaterally into the RVLM of WKY rats and MAP (C) and HR (D) were recorded in a conscious state using radiotelemetry. Blood pressure was elevated after apelin gene transfer into the RVLM of conscious rats. Data are means ±SE from 7 rats (AAV2-Apelin group) and 6 rats (AAV2-GFP group). *P<0.05 vs. corresponding time point in the AAV2-GFP group.
