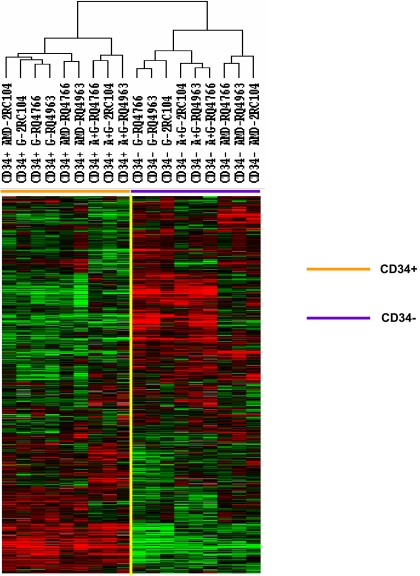
Figure 1.
Comparison of gene expression profiles of CD34+ cells mobilized with plerixafor, G-CSF, and plerixafor plus G-CSF with PBMCs. CD34+ cells were isolated by immunomagnetic selection from plerixafor, G-CSF, and plerixafor plus G-CSF–mobilized PBSCs collected by apheresis. The CD34+ cells and unabsorbed PBMCs were analyzed by gene expression profiling using a cDNA microarray with more than 17 000 genes. The 5378 genes that were expressed in at least 80% of the samples and were increased at least 2-fold in one sample were analyzed by hierarchical cluster of Eisen. G indicates G-CSF; A, plerixafor; A+G, plerixafor plus G-CSF.

