
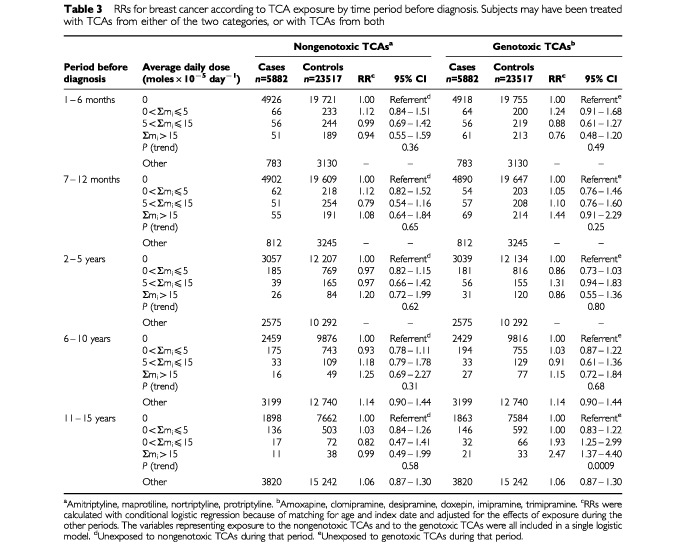
Table 3. RRs for breast cancer according to TCA exposure by time period before diagnosis. Subjects may have been treated with TCAs from either of the two categories, or with TCAs from both.
Official websites use .gov
A
.gov website belongs to an official
government organization in the United States.
Secure .gov websites use HTTPS
A lock (
) or https:// means you've safely
connected to the .gov website. Share sensitive
information only on official, secure websites.