
Figure 3.
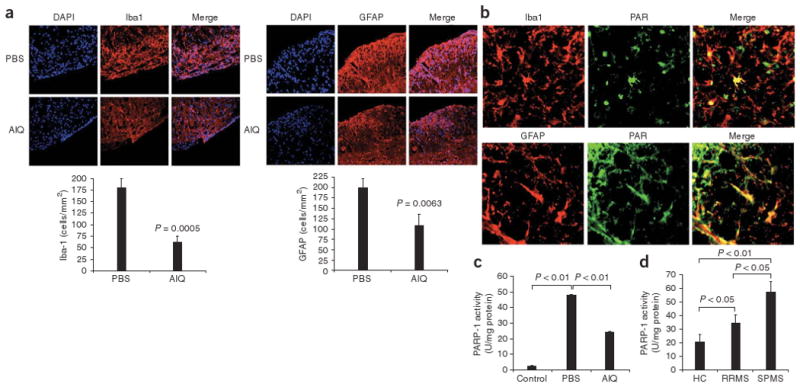
Activation of PARP-1 during human SPMS and secondary progressive EAE. (a) Microsopy of spinal cords from PBS- or AIQ-treated mice for analysis of the presence of microglial cells, CNS-infiltrating macrophages (Iba1) and astrocytes (GFAP); the DNA-intercalating dye DAPI stains nuclei. Original magnification, ×200. Below, quantification of stained cells. P values, Student's t-test. (b) Activation of PARP-1 in the spinal cords of NOD mice during the progressive phase of NOD EAE, assessed as the accumulation of PAR (green) in Iba1+ or GFAP+ (red) cells. Original magnification, ×200. (c) Enzymatic activity of PARP-1 in CD11b+ CNS cells isolated from AIQ- or PBS-treated mice at day 55, during the progressive phase of NOD EAE. P values, Student's t-test. (d) Enzymatic activity of PARP-1 in peripheral blood monocytes isolated from healthy control subjects and patients with RRMS or SPMS. P values, one-way ANOVA. Data are representative of two experiments (c) or two independent experiments (a,b,d; mean and s.e.m.).