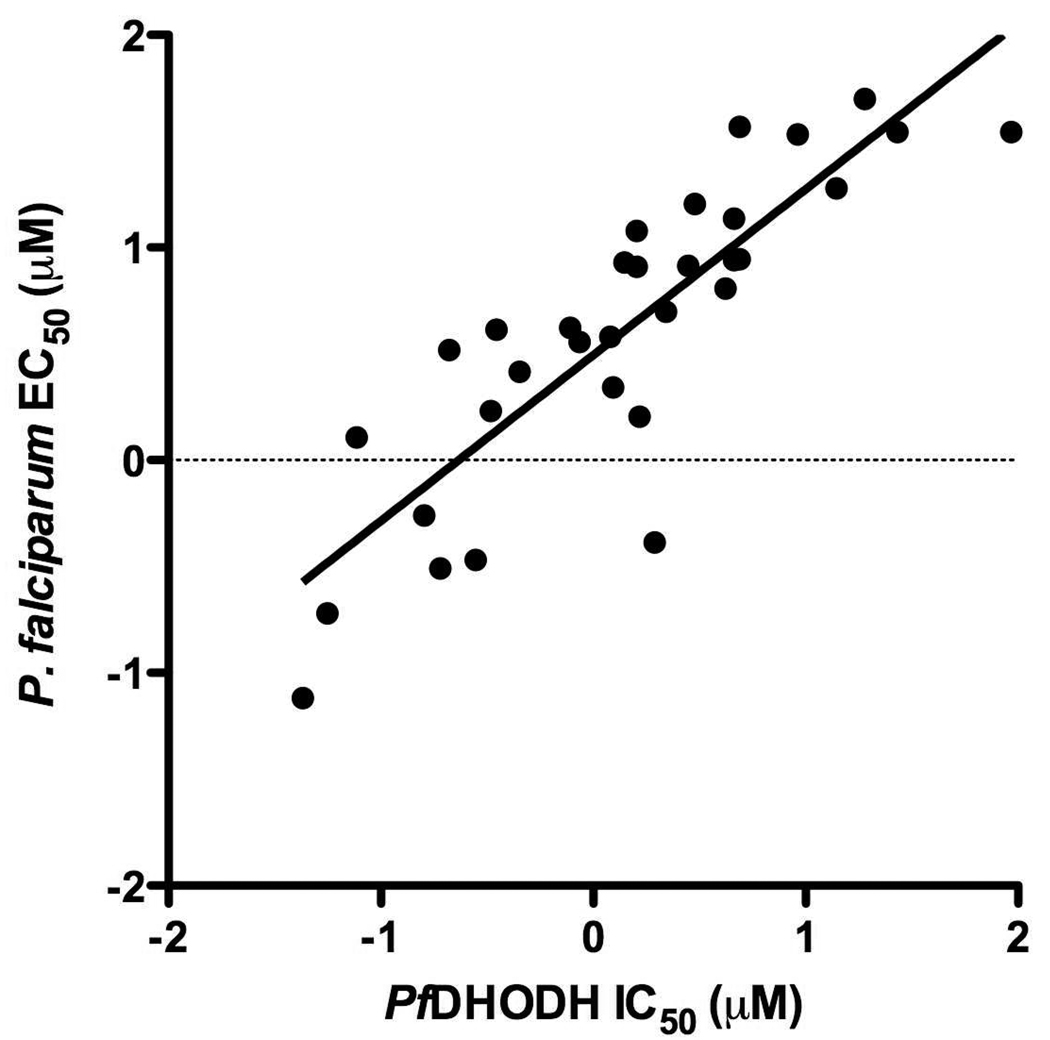
Figure 3. Comparison of the series activity on PfDHODH vs P. falciparum whole cell assays.
The log of the PfDHODH IC50 data are plotted versus the log of the P. falciparum EC50 data (in micromolar). The plotted data include compounds 2, 3, 12, 13, 16, 18, 21, 24, 27, 36, 40, 42 and 47 described in Table 1 and those previously reported from the series (compounds 8–12 and 14–17 from 22). Compounds for which solubility limits prevented the quantitative determination of either the IC50/EC50 have been left off the plot. Data were fitted by linear regression analysis where r2 = 0.73, slope = 0.78 ± 0.087.

