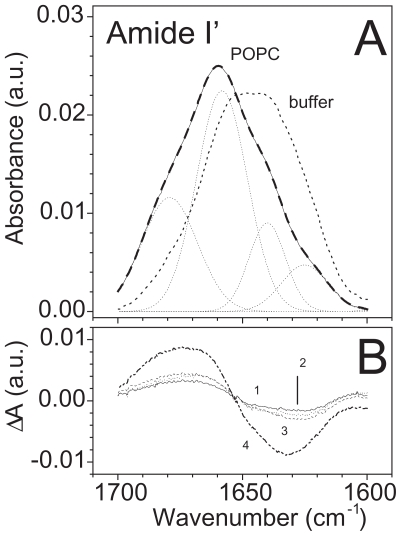
Figure 15.
FTIR-ATR spectra of WLIP in buffer and in lipid mimetic environments: (A) Analysis of the amide I’ band of deuterated films of WLIP samples deposited from a buffer solution (buffer, thick dotted line) or after binding to the lipid membrane (POPC, solid line). The original spectrum (POPC) was deconvoluted and curve fitted to resolve the component frequencies. The corresponding Gaussian bands are reported as dotted lines, and their sum as a thick dashed line superimposed to the original spectrum. (B) Differential spectra were obtained by subtracting the deuterated spectrum of the soluble form in buffer from that in TFE (1), in HFIP (3), in SDS (2) or in presence of the lipid phase (4).

