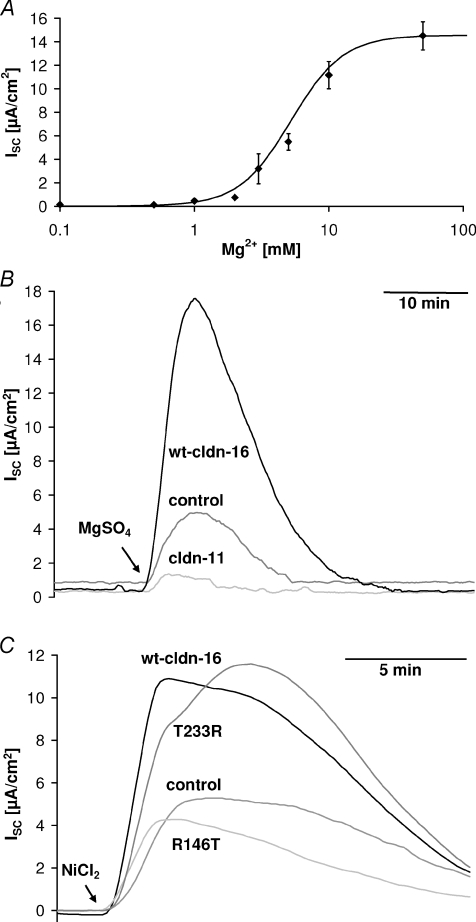
Figure 3. Divalent cation-induced transcellular current.
A, dose–response curve for the transcellular current induced by basolateral Mg2+ application in wt claudin-16-transfected MDCK cells. EC50, 5.2 mm; Hill coefficient, 2.3. B and C, application of divalent cations (B, 10 mm MgSO4; C, 100 μm NiCl2) to the basolateral side induced a transcellular current (short circuit current, ISC) that was considerably larger in wt claudin-16-transfected (B, long version; C, short version) and T233R mutant-transfected cell layers than in R146T mutant claudin-16-transfected, in mock-transfected control cell layers, and, for comparison in claudin-11-transfected cells.

