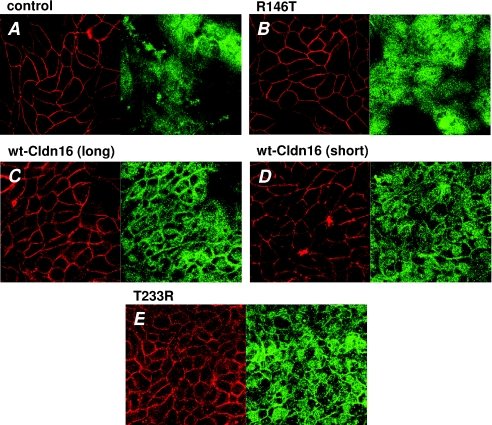
Figure 8. Localization of bestrophin in mutant claudin-16-transfected cells.
Confocal laser-scanning micrographs of wt claudin-16-, mutant claudin-16-, and mock-transfected MDCK-C7 cells. Red, occludin; green, bestrophin; blue, nuclei (DAPI). All micrographs were obtained in the plane of the tight junction, as indicated by the clearly visible occludin signal. A and B, distribution of bestrophin in mock-transfected control cells and R146T mutant-transfected cells was diffuse. C–E, cells exhibiting strong divalent cation-induced current (wt claudin-16- and T233R mutant-transfected cells) showed a prominent accumulation of bestrophin in the tight junction region.

