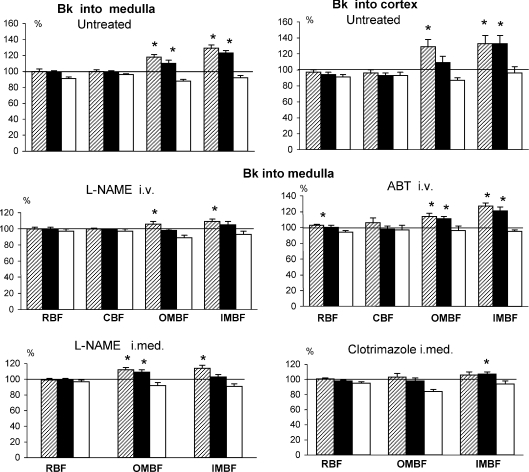
Figure 3. Intrarenal perfusion responses to bradykinin infused into the renal medullary or cortical interstitium.
Bradykinin (Bk) was infused into the renal cortex, 0.75–1.50 mg kg−1 h−1 (right hand upper panel) or into the medulla, 0.3–0.6 mg kg−1 h−1 (all the other panels). Means (%) ±s.e.m. The striped, black and open columns refer to the initial phase of Bk infusion, the final level established during the infusion, and the recovery level after Bk has been withdrawn, respectively. The rats were either untreated (n= 15 for intramedullary and n= 8 for intracortical Bk) or pre-treated with l-NAME (2.4 mg kg−1 h−1i.v., n= 11, or 0.12 mg kg−1 h−1 into renal medulla, n= 12), ABT (10 mg kg−1i.v., n= 12) or clotrimazole (3.6 mg kg−1 h−1 into renal medulla, n= 13). In two groups, CBF measurements had to be discarded because of technical problems. *Significantly different from pre-bradykinin baseline as tested by paired Student's t test.

