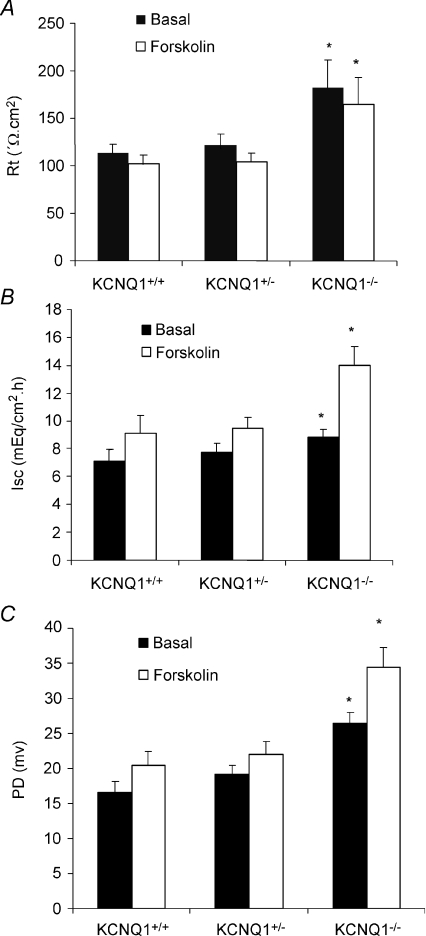
Figure 2. Effects of forskolin (10−5m) on resistance (A), Isc (B) and PD (C) of gastric mucosa in KCNQ1+/+ (n= 11), +/– (n= 14) and −/− (n= 7) mice.
The data shown represent basal value and maximal (B and C) or minimal (A) value after the addition of forskolin. Basal value and maximal response to forskolin in PD and resistance were increased significantly in KCNQ1−/− mice. *P < 0.05. A significant increase in Isc upon forskolin stimulation in KCNQ1−/− mice was noted compared with KCNQ1+/+.

